Properties reported in suppliers’ data sheets for plastics including medical grades are based on testing industry-standard injection molded ASTM or ISO tensile bars. The tests are conducted on standardized equipment under prescribed laboratory conditions. The resultant properties data accurately define a polymer’s properties as tested according to these methods. They are typically used to certify a resin lot’s conformance to the supplier’s established standards for the polymer.
These values are not aways an accurate representation of the properties the material will exhibit in an injection molded component, however. This is especially true in fiber reinforced grades. Several factors come into play that affect material performance in a finished part, such as melt processing conditions, the flow patterns of the material while it is being molded, gating, venting, thermal control of the mold and the part’s design configuration. The distribution of additives in modified polymer formulations, and how they become oriented due to melt flow patterns also play a big role in the plastic’s performance in the finished part.
Properties Differences: Standardized Tests Vs. Samples Machined from Injection Molded Parts
This analysis demonstrates the differences in physical properties between a resin supplier’s Resin Certifications and data sheets, and properties exhibited in tests of tensile bars cut from injection molded plate and oriented in different directions from the material’s melt flow. The thermoplastic tested is 30% carbon fiber reinforced PEEK. The material is used in structural orthotic devices and other high strength medical applications, and was chosen because it demonstrates the effects of both melt flow and how it can change the performance imparted by additives such as fibers.
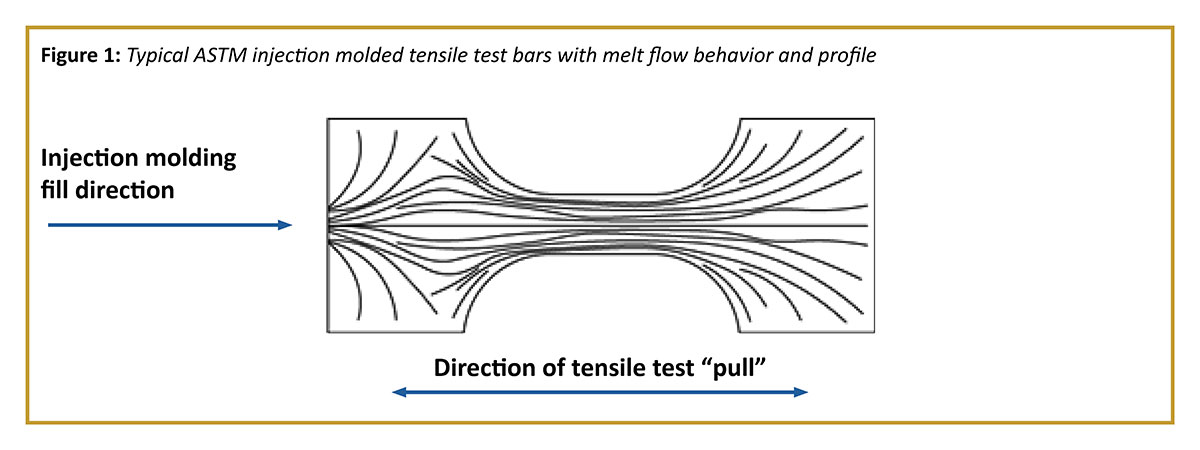
The ASTM tensile bar’s fill profile (Figure 1) shows melt flow direction and how carbon fibers are oriented during injection molding in a typical polished mold that resin suppliers use to test for data sheet properties and resin certifications. The injection pressure fills the cavity and packs out the melt to peak density in the center of the bar. As the mold cools, the plastic freezes in this condition. The polished mold leaves an excellent surface finish with no broken fibers. Internally, the fibers are aligned nearly optimally in the test direction of pull, especially near the surfaces which represent the largest portion of surface area.
Properties Can Differ Significantly in Injection Molded Parts
Table 1 compares a supplier’s Resin Certification data based on ASTM tensile bar testing and properties of tensile bars cut from an injection molded plaque. The plaque was of the same thickness and molded from the same lot of material as the ASTM test specimens.
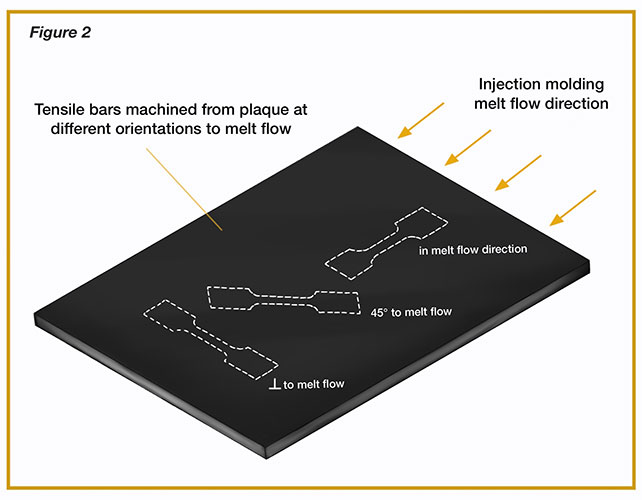
As Figure 2 shows, the tensile bars taken from the plaque were laid out in three orientations to the injection molding melt flow direction, to approximate the plastic’s performance more closely throughout a molded part’s dimensions:
- In the direction of material’s melt flow.
- Oriented at 45° to the direction of melt flow.
- Perpendicular (⊥) to melt flow.
Test results demonstrating differences in properties between these test bars from the molded plaque and the plastic’s data sheet values are shown in Table 1.
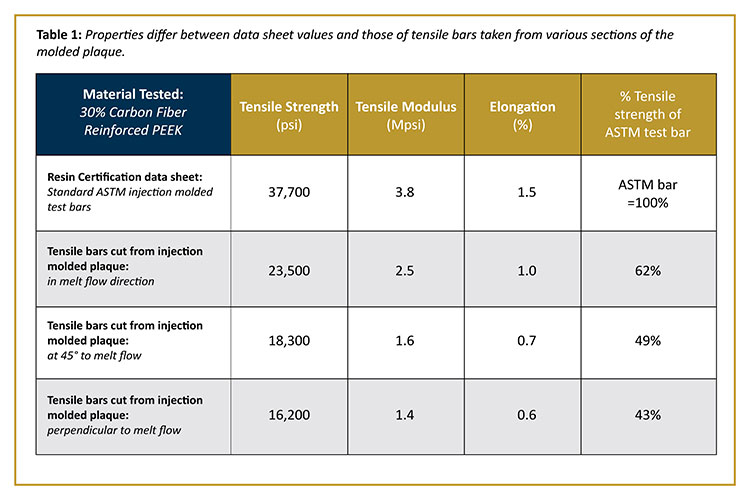
These differences in properties demonstrate the effects of more “real world” conditions on a medical grade thermoplastic’s performance in an actual part.
It should be noted that this analysis is based on a fiber-reinforced polymer. Some unreinforced plastic parts can achieve textbook property values throughout their entire configuration. An injection molder with experience in high performance medical plastics and the right processing equipment and quality management system can help. But that is not true of parts molded from fiber reinforced plastics. The reinforcing strength from fibers is oriented predominantly in the direction of flow. When tested, this orientation yields the most favorable data sheet values for strength, flexural modulus or stiffness, and certain other properties such as coefficient of thermal expansion (CTE).
Using Data Sheets as a Tool for Initial Comparisons
This analysis is not intended to de-value resin suppliers’ published data sheets. It is presented to rectify a common misunderstanding that data sheet values are isotropic and can be expected in molded parts made from a given material. Generating properties data on tensile bars under standardized laboratory conditions is an accepted industry norm. The data sheets provide a useful starting point for evaluating materials and for comparing different suppliers’ versions of the same polymer.
To ensure a level playing field for these basic data comparisons, it is important that the properties are compared based on the same laboratory test conditions. In many cases, suppliers publish data based on more than one set of test conditions such as different levels of temperature and pressure, which will yield different property values.
Testing Finished Parts is Essential to Validate Performance
The bottom line is that factors such as injection molding conditions, additives, fiber orientation, part design, mold design, and process design and control along with the multi-directional stresses that a device must withstand, all affect the real-world performance of the specified material. While data sheets are a good baseline, the effect of these variables on properties reinforces the need to test components under actual operating conditions to fully validate their performance.